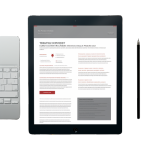
To help hoteliers, revenue managers, IT teams visualize their current distribution technology and to map out the distribution technology strategies for the coming year(s). We have created a version of the popular Hotel Distribution Technology chart that you can edit using PowerPoint and save for your own use.
Quick Guide to the Distribution Chart


The Shiji Distribution Solutions team provided the research on available partners, vendors, and technology, however, for obvious reasons, the chart doesn’t contain every single solution and partner available.
When engineering your own chart, tailor our supplied list of logos and add in your local solutions for a chart that is relevant to your hotel.
We advise you to make one page with your current distribution landscape, followed by a second page with the ideal landscape you are aiming at by the end of the year. You can even make it in multiple phases if a transition period is needed.
Start by using the categories shown in the blank chart to guide you into taking a close look at what systems you are currently using at your property, such as who are your OTA partners, what Revenue Management System you engage, which social media channels you are present on, and continue until you have made your way through all the categories. Once done, place the logos in the respective areas of the chart to represent your current situation.
RELATED:
There you have it: your hotel’s entire distribution landscape as of today, complete with tech products and partners. Needless to say, this is powerful information that will show you any gaps and strong suits of your operation. Use it to guide your strategic decisions on what additional systems (and vendors that will provide you with them) should be invested in to realize your company’s set goals for, say, the next year, or even the next budgeting season.


