Image credit: Adobe Stock/ 3DJustincase.
Generative AI-powered chat interfaces are changing how consumers act online. They’re becoming a helpful assistant for compiling research before making a purchase, as well as helping with travel planning and financial guidance. Adobe issued its first report today profiling the trend, which shows a significant surge to U.S. websites from generative AI sources.
The Adobe Analytics insights are based on direct transactions online, showing the impact of generative AI on the digital economy. The retail insights, for instance, are based on analysis of more than 1 trillion visits to U.S. retail sites, a greater volume of data than is available to any other technology company or research organization. A companion survey of more than 5,000 U.S. respondents provides an additional layer of context on how consumers are thinking about AI in their daily lives.
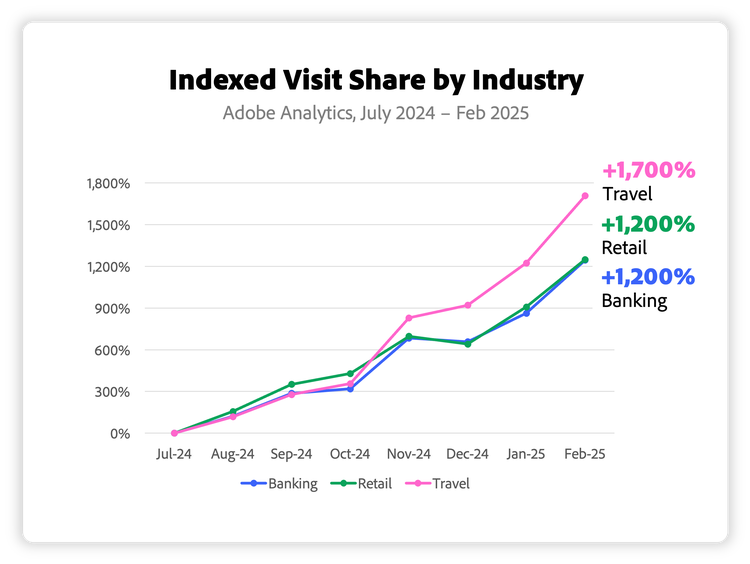
During the holiday shopping season, Adobe observed the first material surge in generative AI traffic to U.S. retail sites (measured by shoppers clicking on a link). Between Nov. 1 and Dec. 31, 2024, traffic from generative AI sources increased by 1,300 percent compared to the year prior (generative AI traffic was up 1,950 percent YoY on Cyber Monday). The trend has persisted beyond the holiday season. In February 2025, traffic from generative AI sources increased by 1,200 percent compared to July 2024. This shows the shift in consumer behaviors over a seven-month period. And while generative AI traffic remains modest compared to other channels, such as paid search or email, its growth has been notable — doubling every two months since September 2024.
In Adobe’s survey of 5,000 U.S. consumers, 39 percent have used generative AI for online shopping, with 53 percent planning to do so this year. The shopping tasks consumers are using generative AI for include conducting research (per 55 percent of respondents), receiving product recommendations (47 percent), seeking deals (43 percent), getting present ideas (35 percent), finding unique products (35 percent) and creating shopping lists (33 percent).
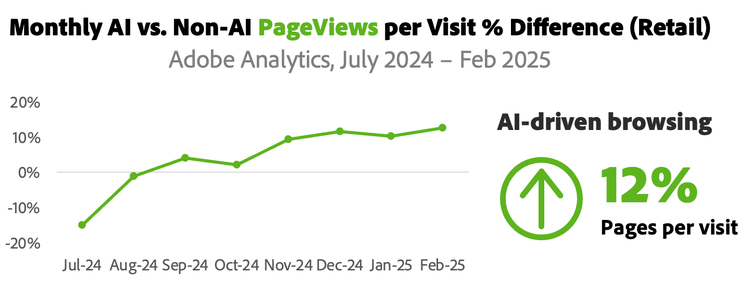
New Adobe Analytics data also profiles what happens once generative AI users land on a retail website. Compared to consumers coming from non-AI traffic sources (including paid search, affiliates & partners, email, organic search, and social media), consumers coming from generative AI sources show 8 percent higher engagement as they linger on the site for a longer period of time. These visitors also browse 12 percent more pages per visit, with a 23 percent lower bounce rate. This speaks to the value of conversational interfaces in online shopping, which seem to help consumers be more informed and confident in their purchases.
Online shoppers say they see benefits in using an AI-powered chat interface, as it shortens the time required for them to receive information that is personalized to their needs. In Adobe’s survey, we found that of those who have used AI for shopping, 92 percent said it enhanced their experience, with 87 percent saying that they are more likely to use AI for larger or more complex purchases. This is reshaping how businesses think about customer engagement, especially with the arrival of AI agents that will be able to handle more complex tasks and make highly tailored recommendations.
Additional Adobe Analytics Insights:
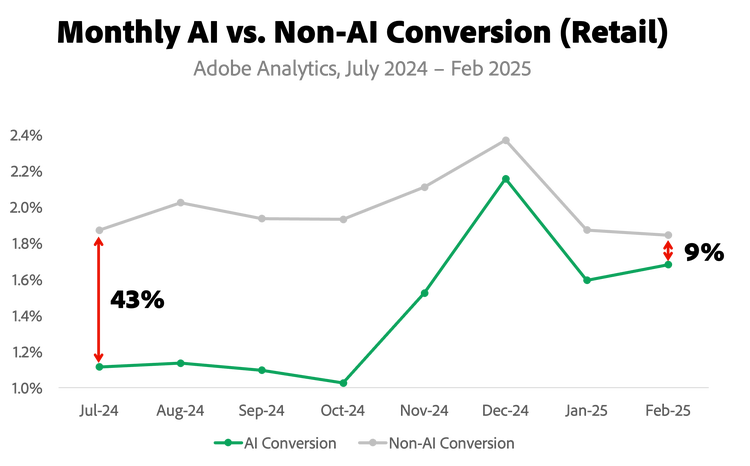
- Propensity to purchase: When it comes to conversion — visits that become purchases — traffic from generative AI sources is 9 percent less likely to convert compared to other sources of traffic. However, this has improved significantly from July 2024, when the same number was 43 percent. The conversion gap reinforces that AI is being utilized during the research and consideration stage, in advance of when shoppers are ready to hit the buy button. But the narrowing gap shows that consumers are also increasingly comfortable completing a transaction directly after an AI-powered chat experience.

- Preferred screen: Traffic from generative AI sources is predominantly coming through desktop devices, at 86 percent share compared to mobile (data from Nov. 2024 through Feb. 2025), with consumers seemingly finding it easier to have a back-and-forth conversation on a laptop or desktop computer. This is in stark contrast to overall e-commerce activity, where desktop share-of-visits came in at just 34 percent during the same time period.
- Category nuances: Across e-commerce categories tracked by Adobe, conversion rates from generative AI traffic are highest in electronics and jewelry — and lowest in the apparel, home goods and grocery category. This indicates that for products such as televisions, consumers are leaning on AI to narrow options based on individual preferences (screen size, resolution, price), which creates a higher likelihood of direct purchase.
Generative AI adoption across other industries
- Travel: The use of AI for planning trips has seen a notable uptick: In February 2025, traffic to U.S. travel, leisure and hospitality sites (including hotels) from generative AI sources increased by 1,700 percent compared to July 2024. In Adobe’s survey, 29 percent of the consumers surveyed have used generative AI for travel-related tasks, with 84 percent of those individuals saying it improved their experience. The top use cases among AI users include general research (per 54 percent of respondents), travel inspiration (43 percent), local food recommendations (43 percent), transportation planning (41 percent), itinerary creation (37 percent), budget management (31 percent) and packing assistance (20 percent). Once users land on a travel site, Adobe Analytics data shows a 45 percent lower bounce rate among consumers coming from a generative AI source — showing a consumer who is more informed and engaged.
- Financial Services: Consumers are also engaging with AI for guidance on managing personal finances. In February 2025, traffic to U.S. banking sites from generative AI sources increased by 1,200 percent compared to July 2024. In Adobe’s survey, 27 percent of those surveyed have used generative AI for banking and financial needs. The top use cases among AI users include getting recommendations for checking and savings accounts (42 percent), asking for explainers on investment strategies and terminology (40 percent), creating a personalized budget (39 percent) and understanding the tax implications of financial decisions (35 percent). As in retail and travel, AI users are more engaged: Once they land on a banking site, visitors spend 45 percent more time browsing (versus non-AI sources).


