
The global OTA landscape is often discussed, as the Booking / Expedia duopoly, yet it is surprisingly rarely visualized in a global way that makes it truly actionable for hoteliers. Everyone knows the big names. Few people understand their real weight, their regional power, and how dramatically uneven the market actually is. We are also sharing the complete dataset as a Google Sheet, for 10 Minutes News subscribers.
That is precisely why our team spent weeks compiling what we believe is the most complete and practical overview of the OTAs of the world, structured by organic traffic, paid traffic, ownership groups, and geographic reach. The typical way to categorize OTAs is on their Market Cap, however we find this measure to be flawed. It isn’t very useful for a hotelier to know the market cap of Airbnb, when trying to determine if they should list their hotel there.
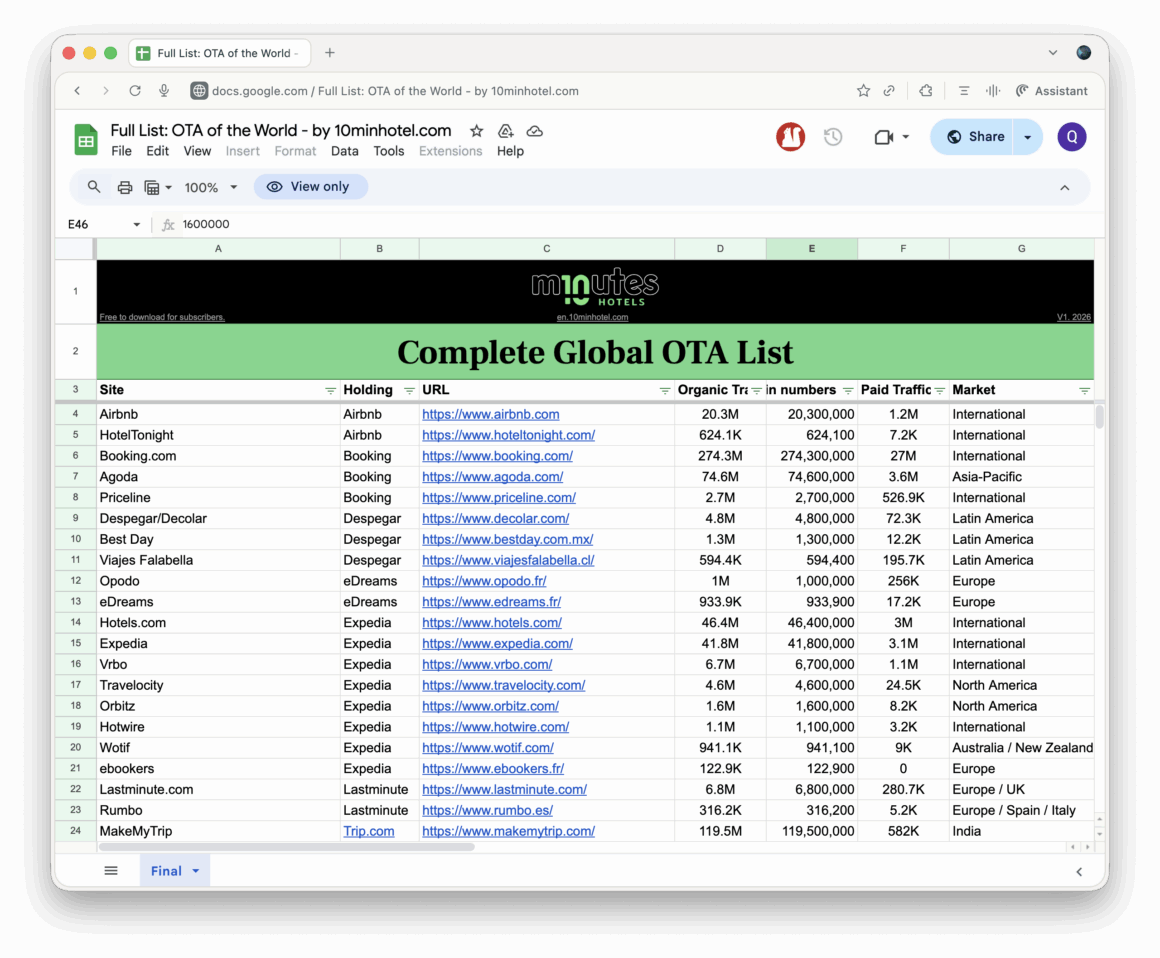
The complete Google Sheet’s document is available to 10 Minutes News subscribers for free. Click here to request yours, and we will send you the link to the Google Sheet.
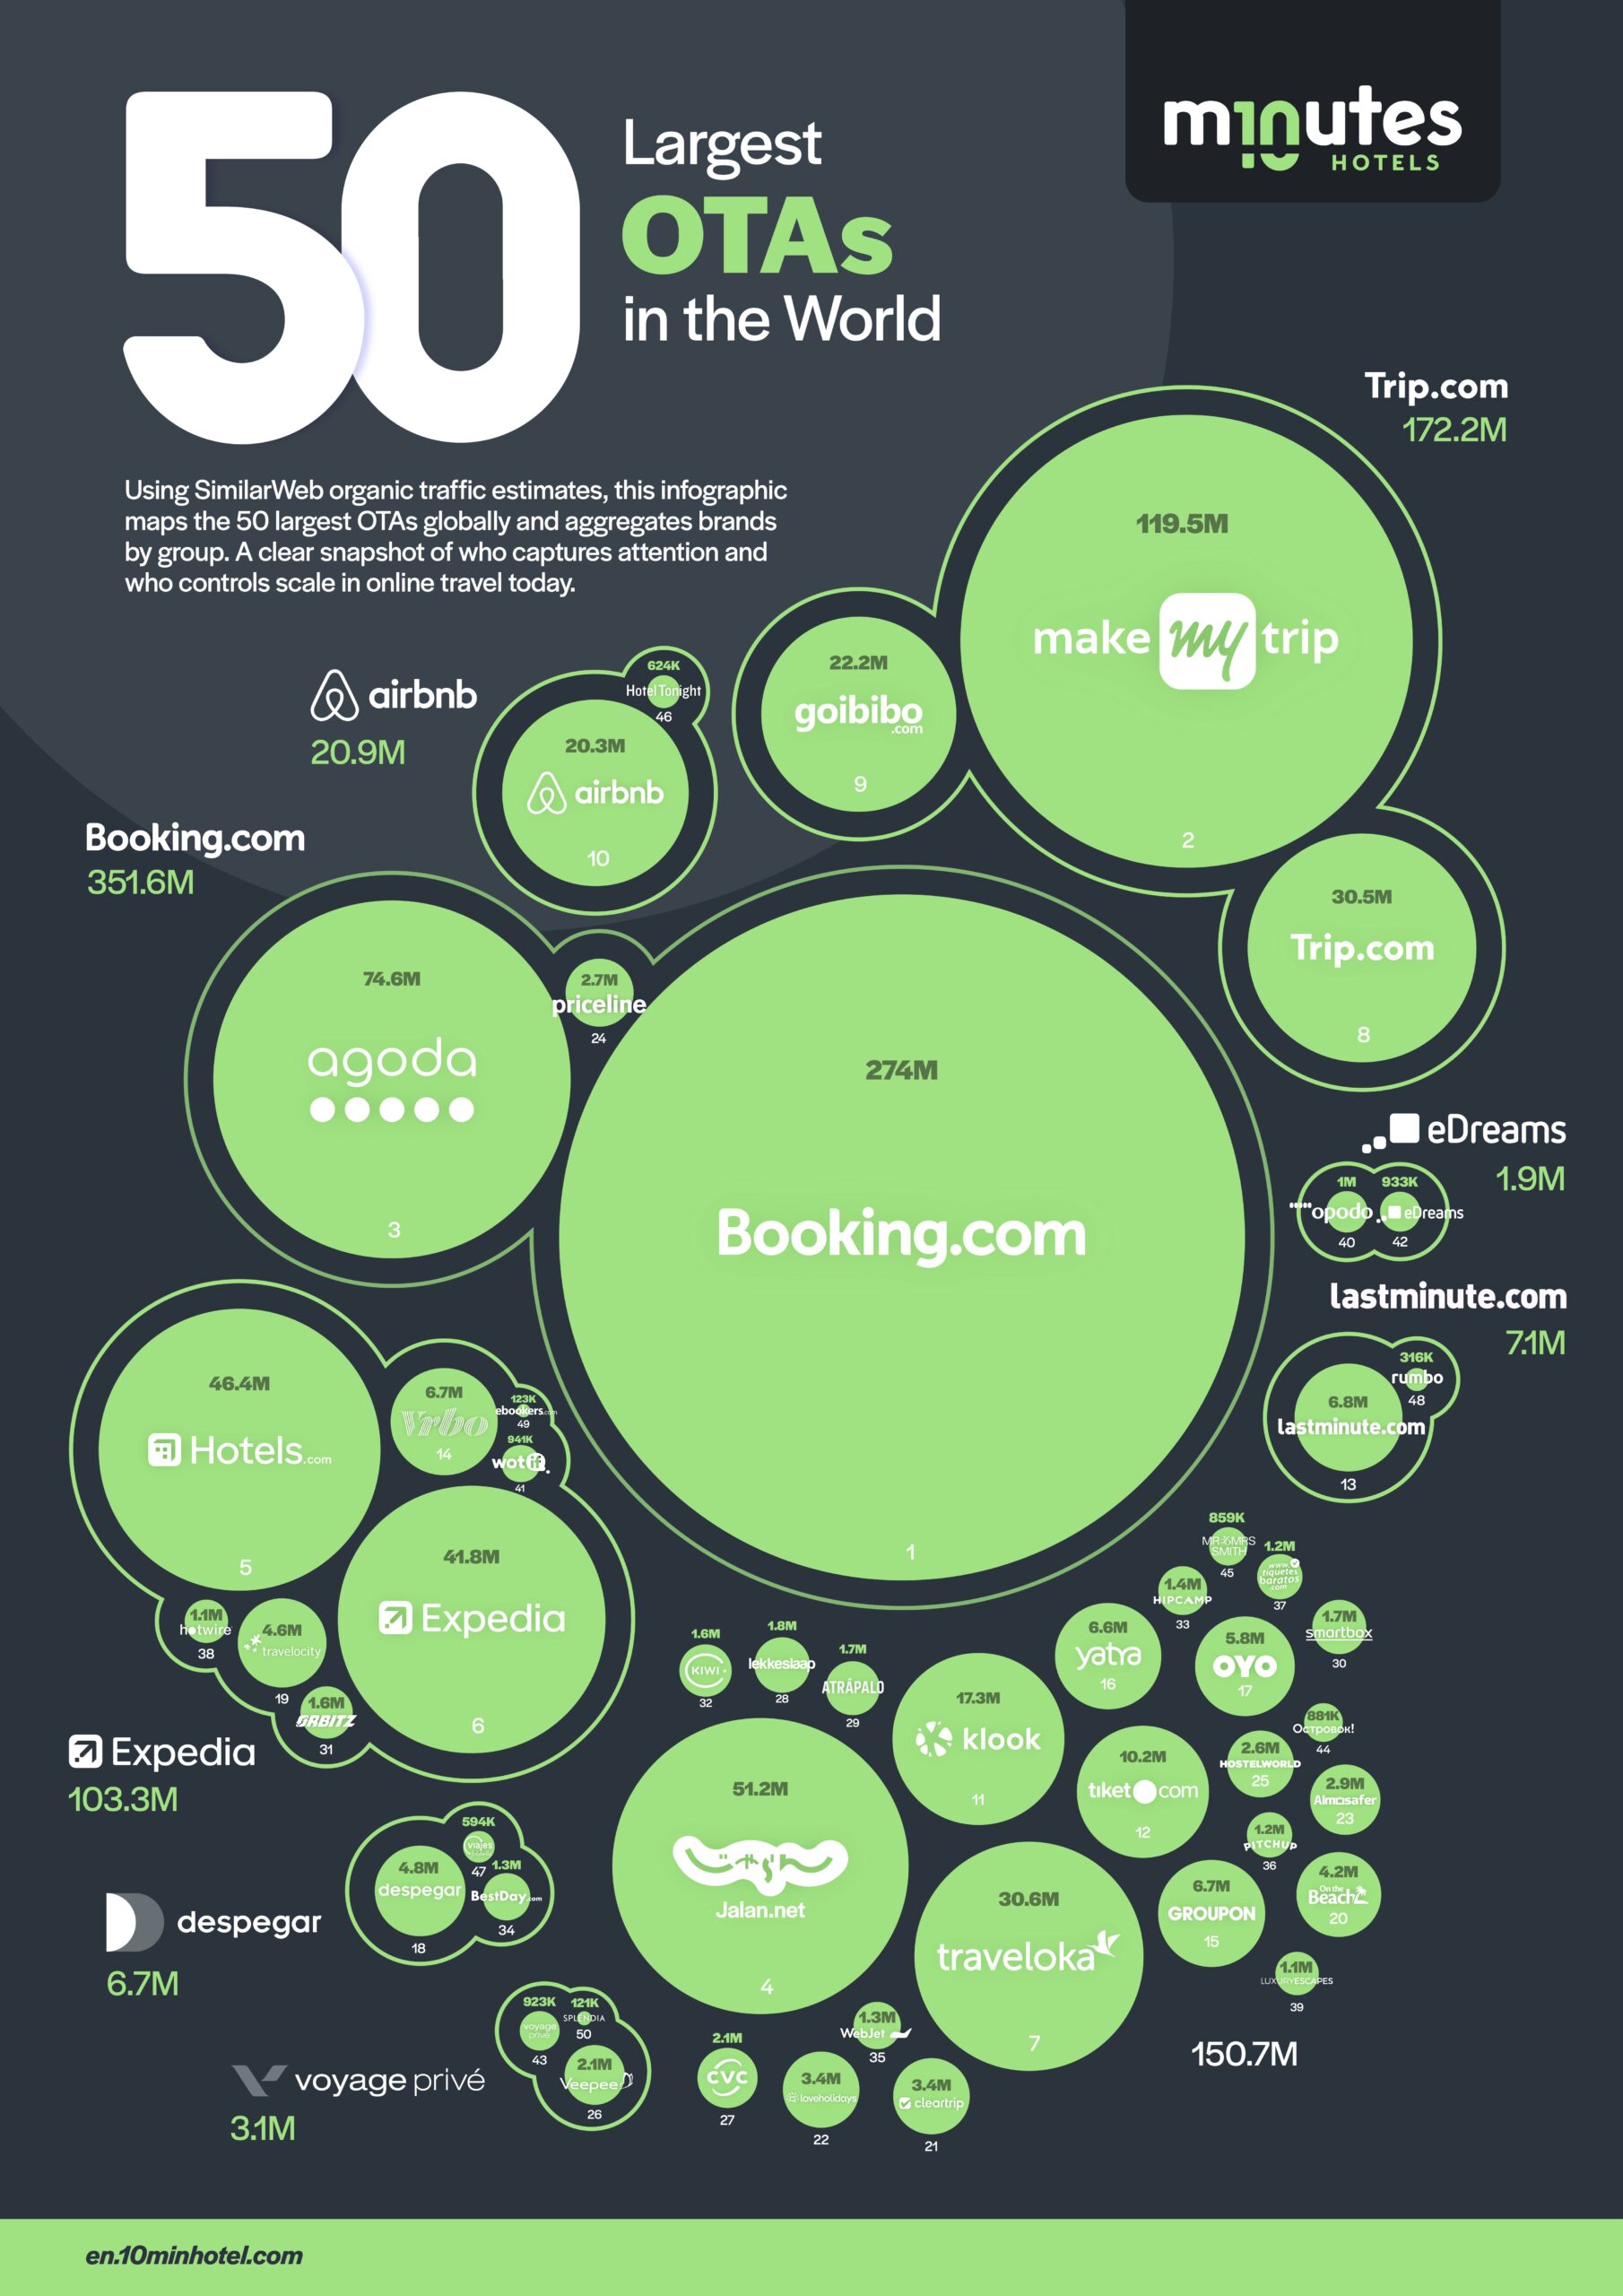
What immediately stands out from the data is how concentrated the OTA market truly is. Booking.com alone attracts roughly 274 million organic visits per month. That single site is 2.6X larger than the entire Expedia Group combined. This gap is not incremental. It is structural.
Even more surprising is the position of the Trip.com Group. With approximately 172 million monthly organic visits, it sits comfortably in second place worldwide. At this rate it will be double Expedia’s organic footprint soon (it is 1.6X now) and roughly half of Booking.com’s scale. Despite this, Trip.com is still frequently underweighted by hotels outside Asia Pacific, largely because its strength is regional rather than evenly global.
Another eye opening insight comes from Airbnb. While it has frequently dominated headlines and public conversation, its organic traffic sits at roughly 20 million visits per month. That makes it more than ten times smaller than Booking.com in pure discovery volume. Airbnb is influential, but the data shows that its demand engine is far less dominant than many assume when compared with traditional OTAs.
Across the dataset, a few patterns repeat themselves clearly. Booking.com is the only truly global demand machine with deep penetration across Europe, the Americas, Asia Pacific, and emerging markets. Expedia remains heavily concentrated in North America with far weaker visibility elsewhere. Trip.com overwhelmingly controls Asia Pacific outbound demand but has limited reach in Europe and the Americas.
In fact once one is out of the big names, OTAs are highly regional with brands like MakeMyTrip, HRS, Travelooka, Despegar being strong in their markets but not very strong internationally.
These findings matter because distribution strategy is ultimately a question of focus, risk, and operational maturity. In theory, being connected to every possible OTA maximises exposure. In practice, each additional channel increases complexity, API synchronisation risk, overbooking exposure, rate leakage, and content management overhead. The more connections a hotel maintains, the more operational discipline and technical reliability it must sustain.
We hope the dataset becomes useful in optimizing a hotel’s distribution strategy.
To build this overview, the team at 10 Minutes Hotel researched, compiled, and cross verified data from multiple sources, including traffic estimation from SimilarWeb and regional OTA mappings.
The final output includes a visual infographic ranking the top 50 OTAs and OTA groups worldwide, alongside a fully sortable Google Sheet version (for subscribers). Hotels can filter by region, ownership group, accommodation type, and demand profile.
If you notice anything incorrect, please help us improve it by reporting it on this form. We will try to update the table and the infographic frequently.