We are excited to officially release another ambitious project we have worked on at 10 Minutes News.
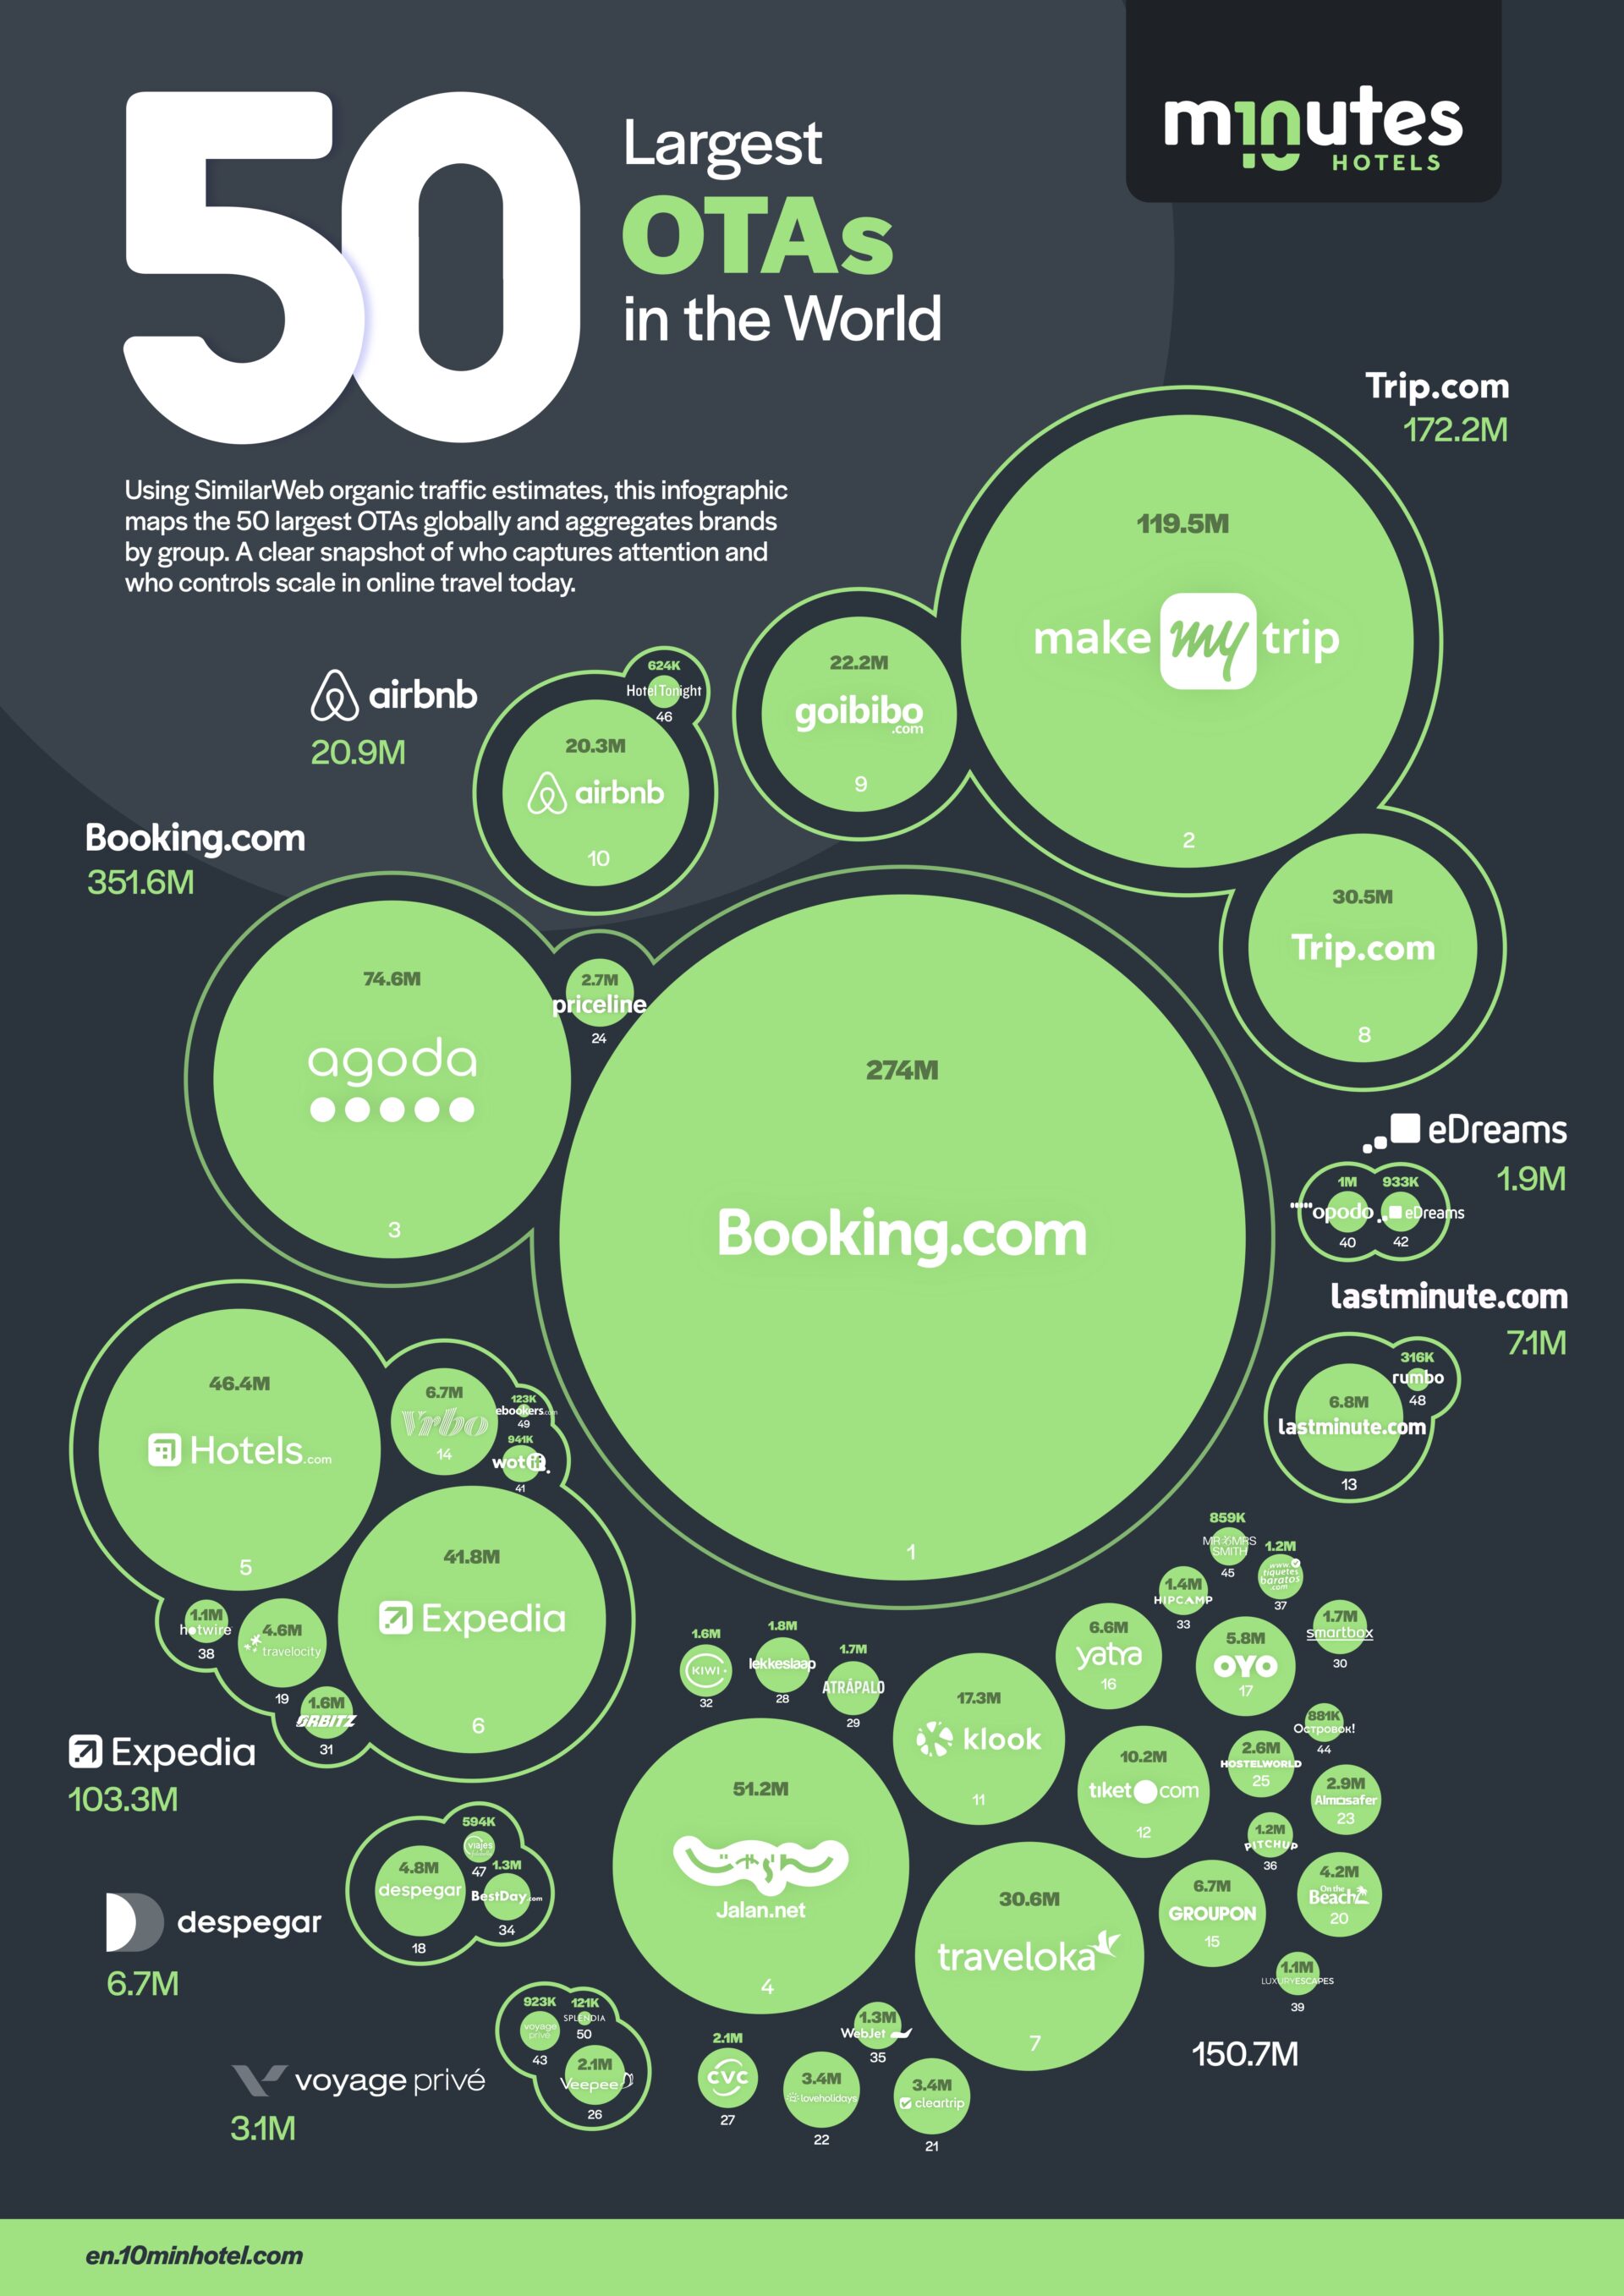
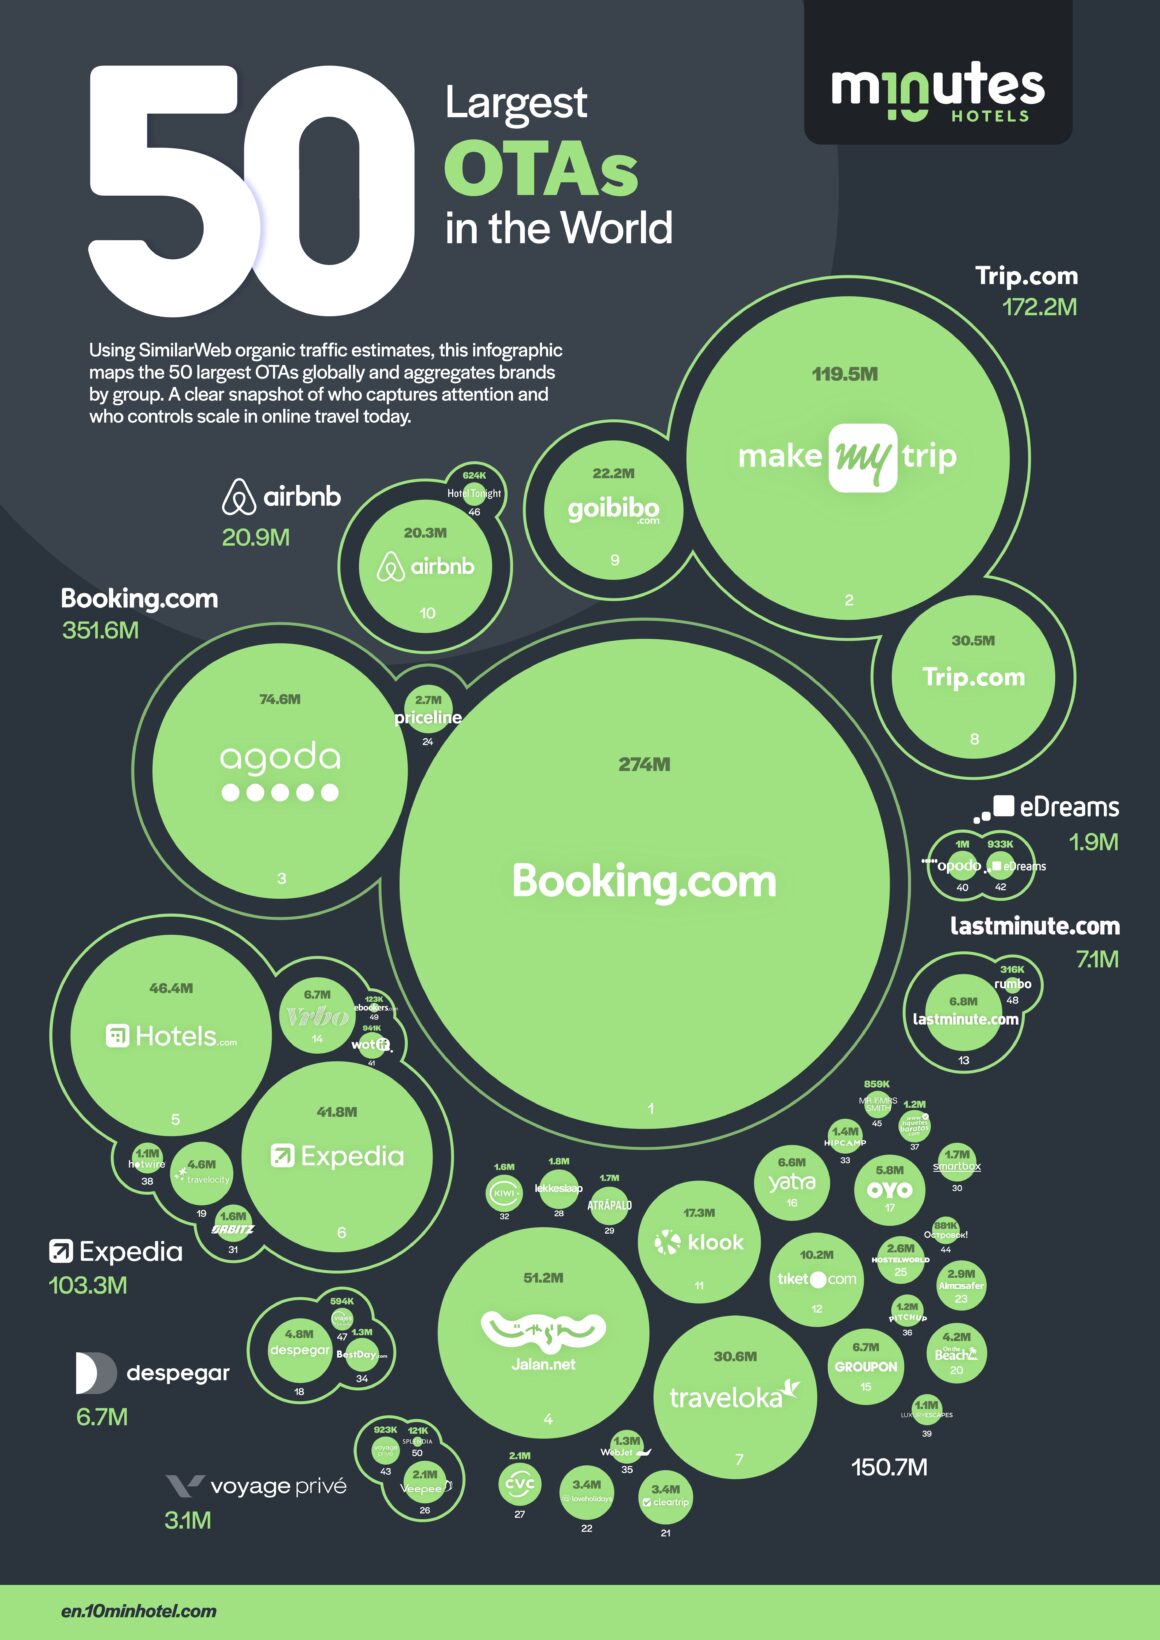
After hundreds of hours of research, cross verification, and manual work, we are publishing a new chart that maps the OTAs of the world based on something far more practical than market capitalisation. Real reach. Real visibility. Real demand. Alongside the chart, we are also releasing the full underlying dataset that powers it.
This project started with a simple question. Who actually drives hotel demand, and where. To answer it properly, we analysed organic traffic, paid traffic, ownership groups, and regional focus across a vast number of OTAs worldwide. The result is a clear visual overview and a detailed dataset that hotels, consultants, and industry professionals can actually use to make smarter distribution decisions.
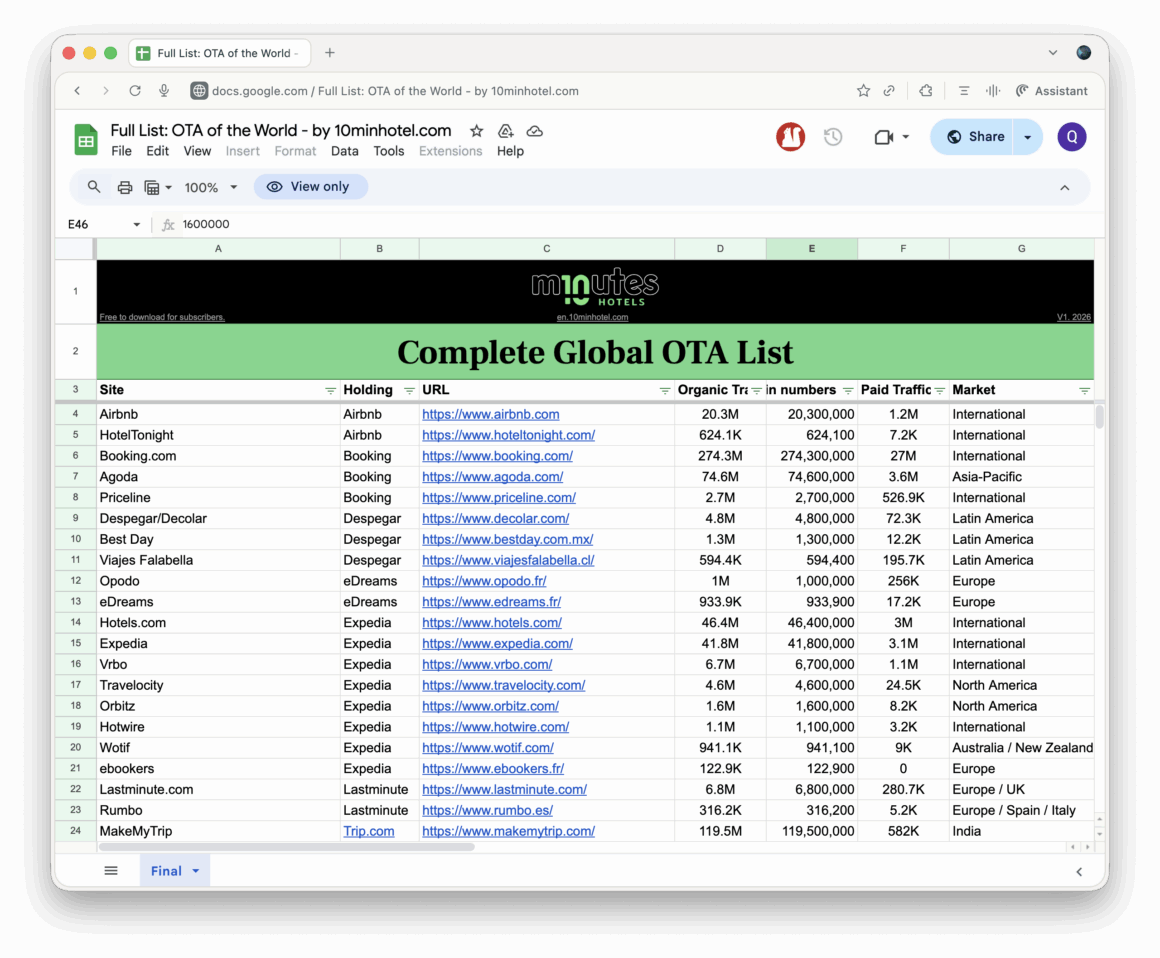
The full dataset is available for free to all subscribers of 10 Minutes News. Subscribers can download the complete Google Sheet, explore the data, filter by region, and understand which platforms truly matter depending on the demand they want to capture. Our goal is not just to publish charts, but to give the industry tools that are genuinely useful.

Because this landscape is constantly evolving, we also want this to be a living project. For now, we invite the community to use the LinkedIn post linked here to flag any OTAs they believe are missing from the list or incorrectly represented. This will help us refine and improve the dataset in the short term.
In parallel, we are building a proper submission form so that anyone who has additional data, corrections, or new platforms to suggest will be able to contribute in a structured way. As with our other major data projects, we plan to keep this updated over time and make it better with the help of the industry.
If you are not yet a subscriber, this is also the moment to join and get access to the full dataset.
We are proud of this work, grateful for the feedback already coming in, and excited to see how the industry uses it.