The global hotel industry continues to make steady progress in guest satisfaction, with the latest Q1 2026 Guest Experience Benchmark, by Shiji Reviewpro showing that overall quality has now moved well beyond the immediate post pandemic recovery period. The Global Review Index (GRI) reached 86.3%, compared with the post reopening average of 84.3%, illustrating that hotels are no longer simply rebuilding operations. They are improving them. While comparing against the difficult years immediately after COVID may no longer be the most meaningful benchmark, the long term trend is encouraging. The industry appears to have regained consistency, with global satisfaction now sitting much closer to the historical peak of 92.3% than the all time low of 78.0%.
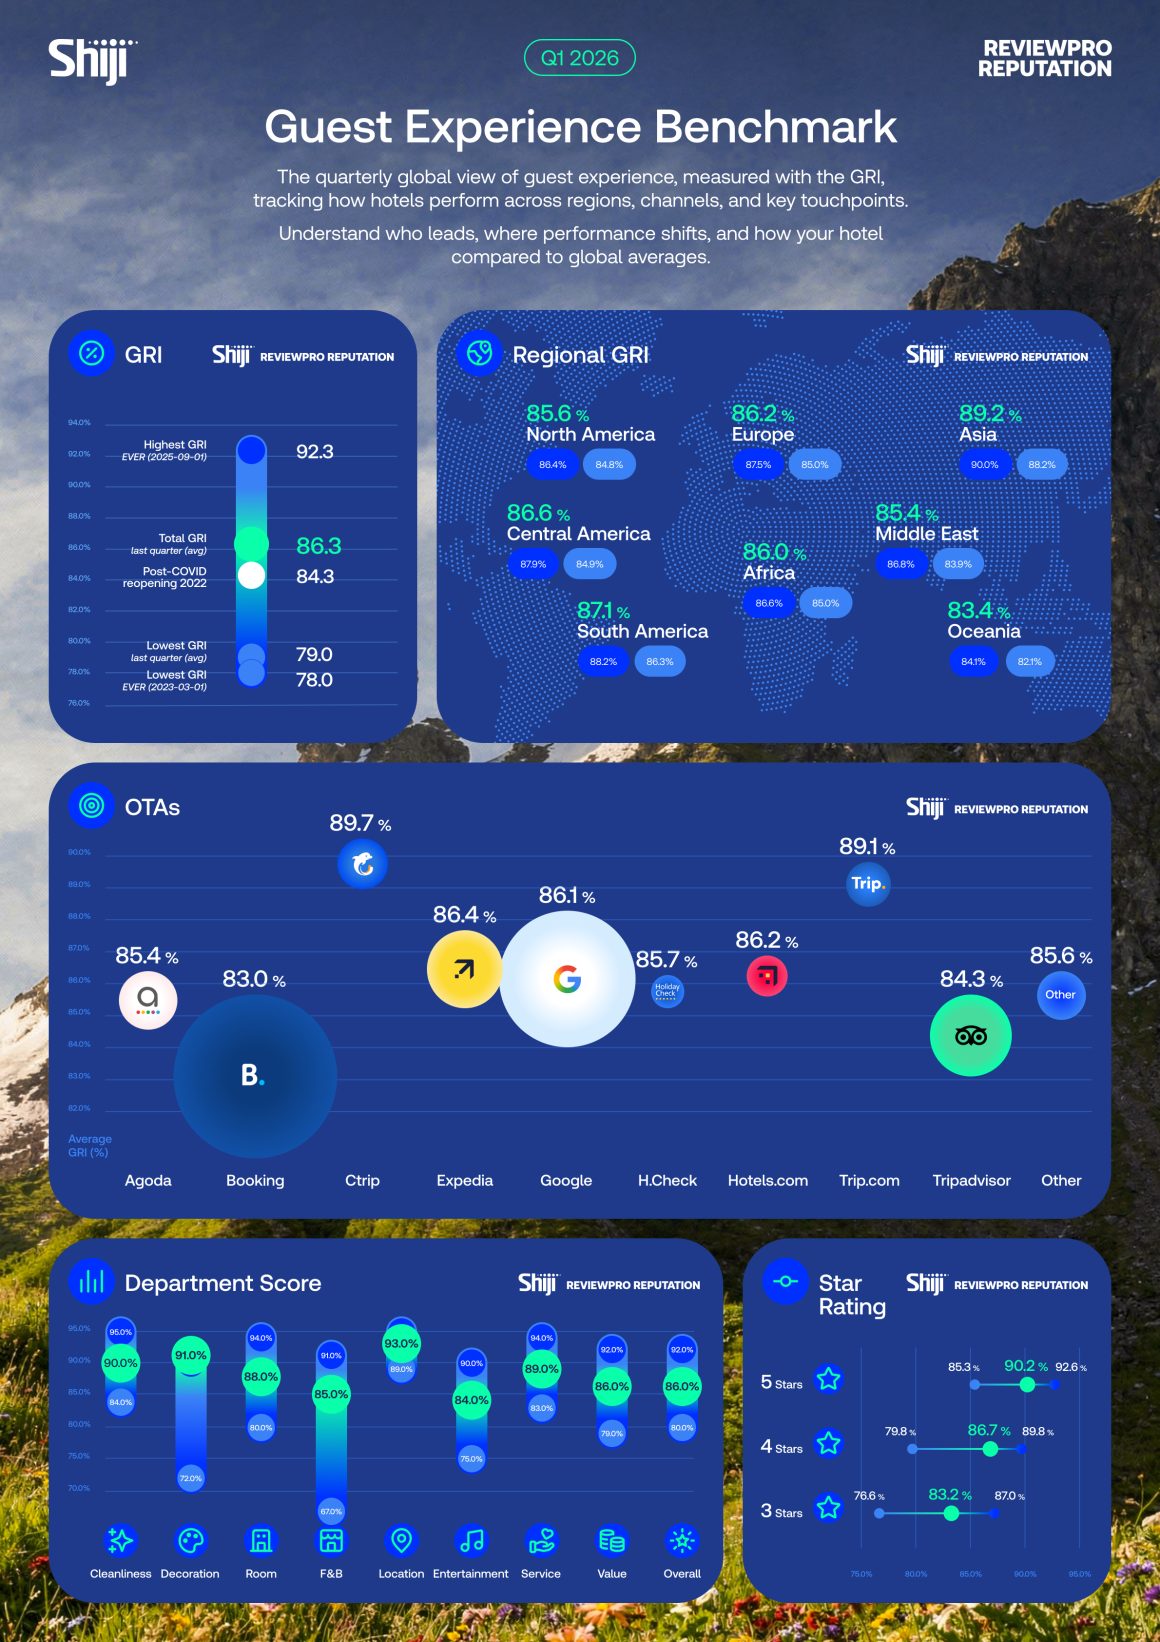
Regionally, Asia remains the clear leader with a GRI of 89.2%, comfortably ahead of every other region. South America follows at 87.1%, while Central America (86.6%), Europe (86.2%), Africa (86.0%), North America (85.6%), and the Middle East (85.4%) all cluster remarkably close together. Oceania stands out as the only region materially below the global average at 83.4%, suggesting there is still room for improvement.
Perhaps the most surprising finding comes from the online travel agencies. Despite generating by far the largest volume of hotel reviews, Booking.com records the lowest average guest satisfaction at just 83.0%. This is particularly interesting because Google, whose reviews are often criticised for including people reviewing landmarks, buildings, restaurants, or even locations rather than actual hotel stays, achieves a significantly higher average of 86.1%. Even more surprising is Tripadvisor, historically regarded as one of the industry’s toughest audiences, posting 84.3%, also ahead of Booking.com. Expedia, at 86.4%, sits almost exactly on the global average, making it arguably the most representative platform when looking at overall guest sentiment across the industry.

The departmental scores also reveal an interesting pattern. Guests agree most strongly on location, cleanliness, and service, suggesting these aspects are relatively objective and consistently experienced. Hotels score 93% for location, 90% for cleanliness, and 89% for service. By contrast, decoration, food and beverage, and entertainment show the widest variation in guest opinions. Decoration ranges from approximately 72% to 91%, food and beverage from 67% to 85%, and entertainment from 75% to 84%, highlighting how subjective these experiences remain. Personal taste, cultural expectations, and differing guest priorities likely play a much larger role than they do for cleanliness or location.
The relationship between hotel category and guest satisfaction remains exactly as expected. Five star hotels achieve the highest average GRI at 90.2%, followed by four star hotels at 86.7%, while three star properties average 83.2%. More interesting is the spread of scores within each category. The performance gap is largest among three star hotels, indicating much greater variation in quality and guest experience. Five star hotels, by comparison, deliver a far more consistent experience, reflecting the operational standards and guest expectations associated with luxury properties.
Taken together, the benchmark paints a positive picture for the industry. Guest satisfaction continues to improve globally, operational consistency has largely recovered from the disruption of recent years, and service fundamentals remain strong. At the same time, the data reminds hoteliers that differentiation increasingly comes from the more subjective parts of the guest journey. While cleanliness, service, and location have become industry fundamentals, decoration, dining, and entertainment continue to offer the greatest opportunity for hotels to exceed expectations and distinguish themselves from competitors.